
Material Consumption &
Climate Vulnerability
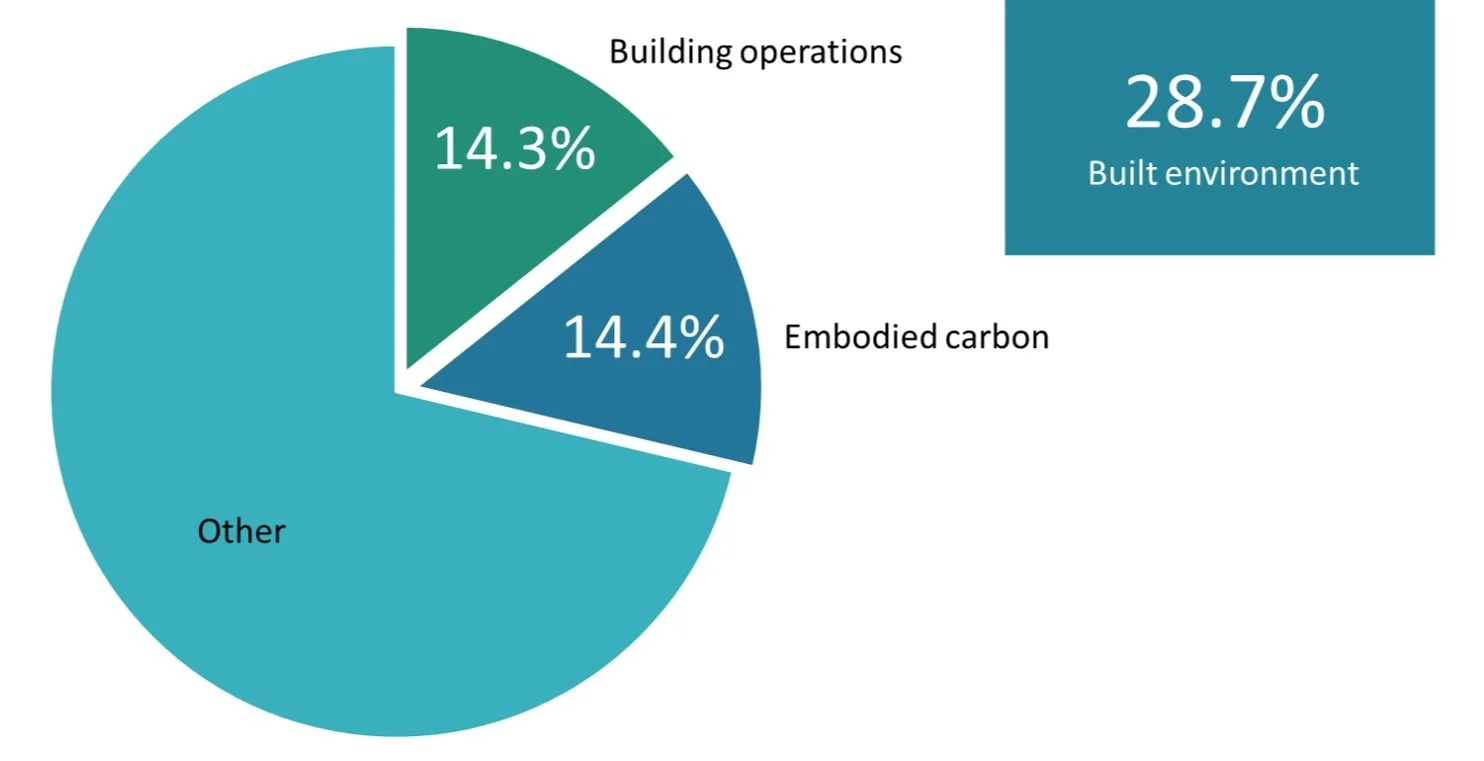
‘Materials’ form the basis of all economic activities. The materials needed to build and maintain structures (e.g. buildings) and infrastructure (e.g. roads) in Oregon accounts for nearly 29% of Oregon’s overall climate altering greenhouse gas emissions. It shows the impact of the Oregon way of life in terms of climate affecting emission. The 2021 data shows how much we Oregonians rely on materials produced outside the state. They also reveal the deep inequity and vulnerability that can affect Oregonians differently.
Want details? Check out the latest reports.
Overview
Climate change is a worldwide effect. It doesn’t matter where the emissions occur. The linkages between climate and well-being are experienced here in the Pacific Northwest as intense wildfires, long spans of hazardous air quality, loss of property, and increased vulnerability for many residents. Let’s examine what the data reveals.
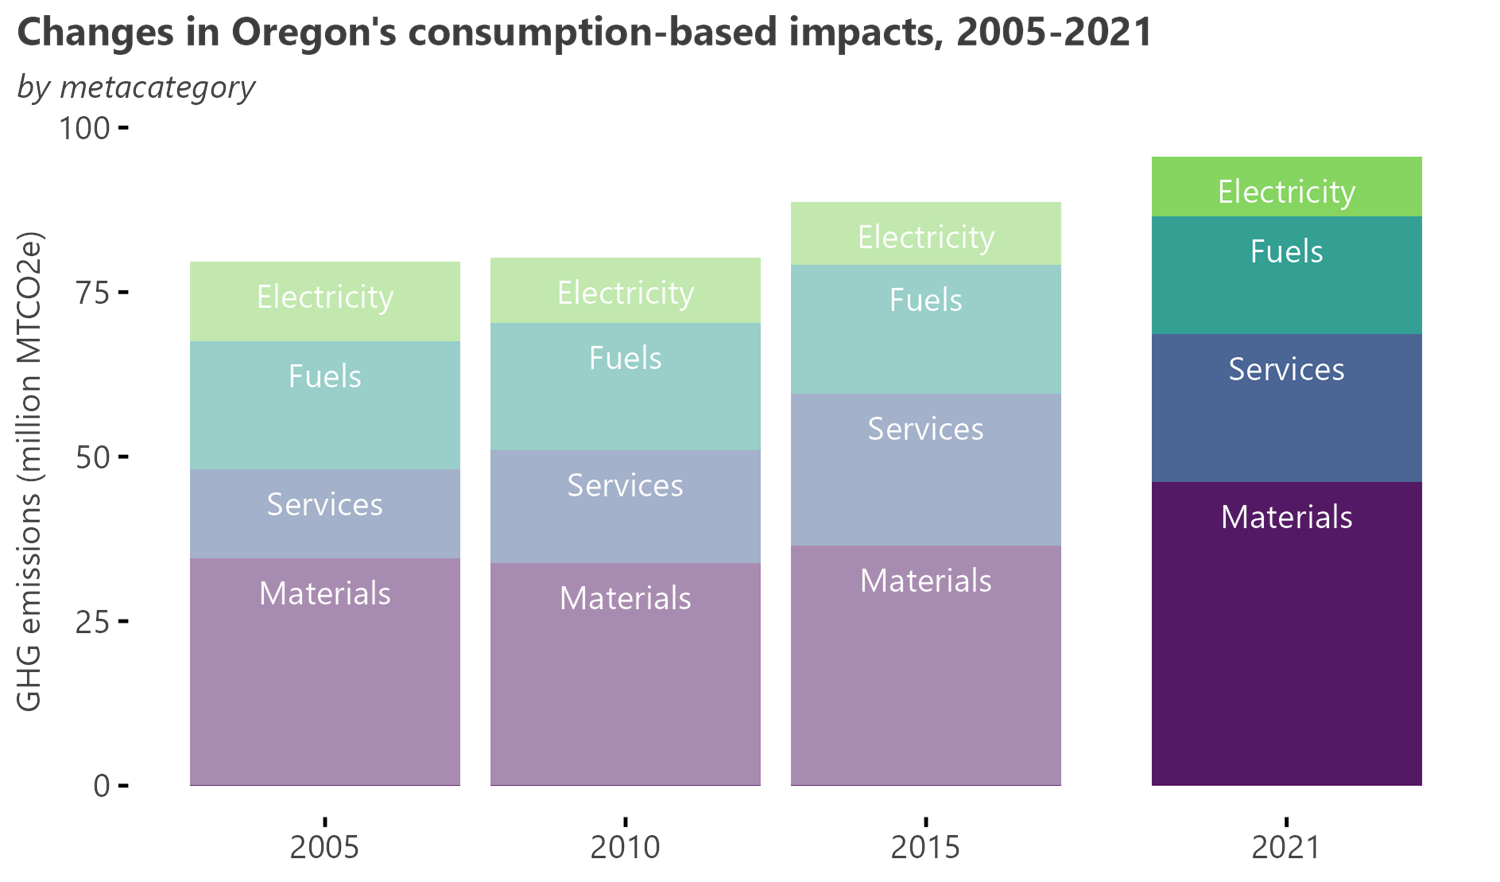
The 2021 data shows us some thought provoking revelations.
Materials and Services together accounts for two-thirds of the total emission of greenhouse gases.
Efficiency: All our efforts to use materials and energy more efficiently are paying dividends. Things like cleaner energy, electrification, less waste, and capital investments are helping a lot. Oregon’s economy about 16% more efficient than twenty years ago.
And, during the same time, the sheer volume of stuff we consumed dwarfs all that diligent efficiency improving efforts. Today, our consumption footprint during the same twenty years has grown by nearly 33%. In sum, Oregon’s overall contribution to climate altering emissions have risen by 17% despite our collective efforts.
Since 1990, factoring in population growth and all efficiency improvements by business, government and households, the overall gap between local actions and offshored emissions has expanded by six fold.
Addressing how and what we consume in Oregon is fundamental.
Oregon’s Reliance on the Material Networks

The chart to the right shows where the emissions are occurring for different material categories. The blue and green phases of the horizontal bars represent the emissions that occur in other states and other countries on our behalf. A few takeaways to draw attention to include:
Only about 32% of the emissions occur inside Oregon. A full 68% of Oregon’s emissions are happening outside, in other states (42%) and in other countries (26%).
Along with the Construction sector, many other areas contribute to the overall impacts of the built spaces of Oregon. They include things like: Vehicles, Appliances, Services, Transportation, Electronics, Furnishing, Lighting, Water and Wastewater treatment.
For Vehicles and Parts, the bulk of the emissions are happening locally due to using fossil fuels for operating the vehicles.
The Food and Beverages category shows most of the emissions happening elsewhere on our behalf. That is because Oregon imports the vast majority of the foods we consume. Our agricultural products do not fulfill our dietary needs.
Responsibility in a Global Material Network
The built environment is fraught with many human rights and unjust labor practices. There are many people whose labor and well-being is taxed to produce the materials we consume to maintain our well-being. The above chart is modified to show the extremely low wages that are part and parcel of many different materials used in Oregon.
On the path to sustainable futures, it is important to view our data through the lens of responsibility because our aspirations are intimately tied to those of people and places in the material supply networks. When considering societal aspirations about equity and justice, access and affordability, it is critical to ethically account for the wide discrepancies built into climate vulnerability. The Built Environment program sets a strategic priority for climate justice and well-being.

Climate Vulnerability & Household Income

The chart to the left shows the 2021 data parsed out by household income. This is critical slice of the data because it shows that the higher income household emit more climate altering pollution. A few takeaways to draw attention to include:
Vulnerability to the various effects and outcomes of climate change (e.g., heat, fires, smoke, health and resilience) is generally higher for families with fewer means.
In 2021 the median income in Oregon was about $71,000.
A little more than half of the households of Oregon falls below the median income bracket.
Make a fairly simple assumption: that households below the median income level are more vulnerable to climate change, that could mean up to 2.1 million Oregonians may be vulnerable to changing climate in the coming decades.