
Climate Equity & Vulnerability
in Oregon’s Material Consumption
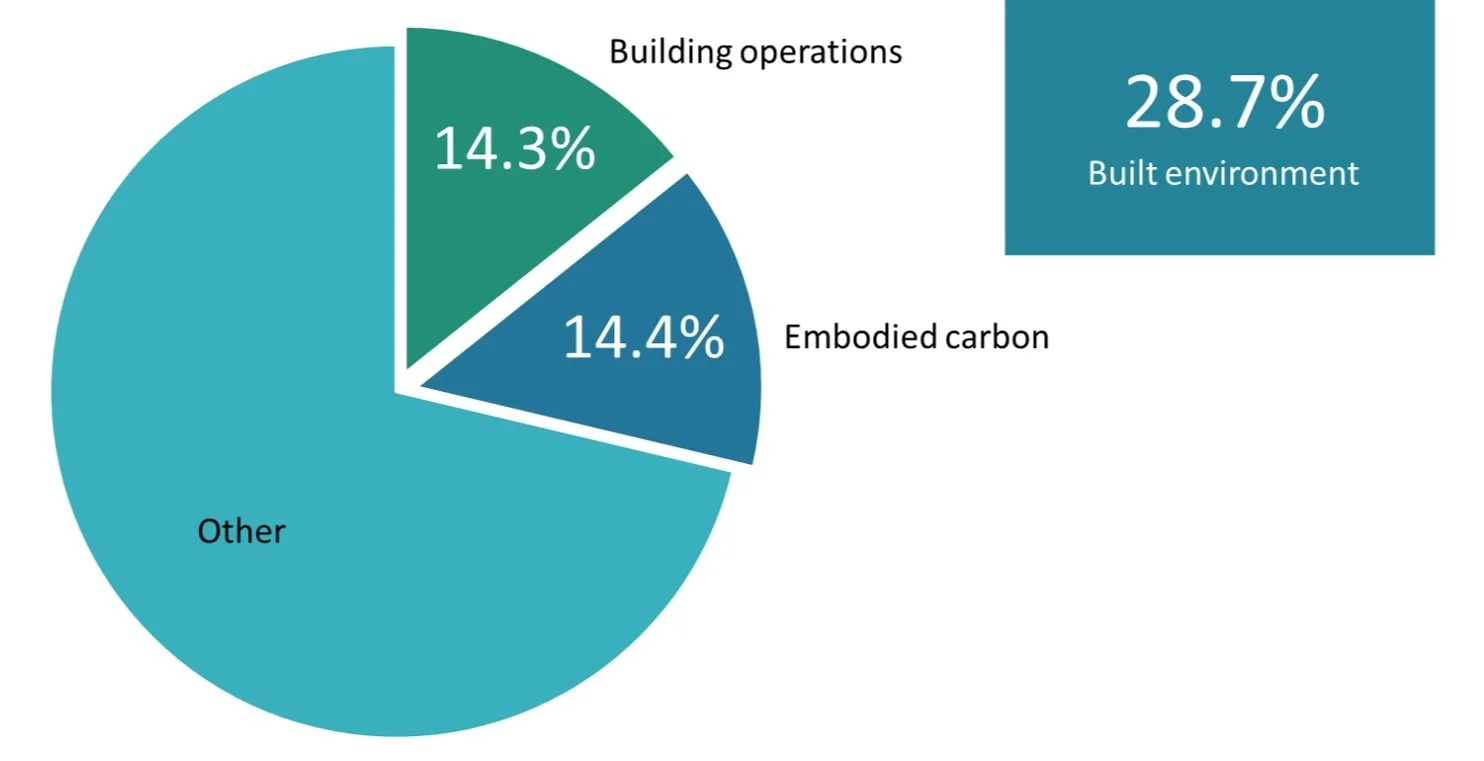
Climate altering emissions (greenhouse gases) and the Built Environment intersect in many significant ways. The materials used to build and maintain Oregon’s towns and infrastructure accounts for nearly 29% of Oregon’s emissions for the 2021 consumption-based greenhouse gas emissions. This is an introduction to Oregon’s 2021 data. For details and recommendations to the legislature see full reports.
Background

In-Boundary Inventory: The Orange/Green circle - includes all the economic activities that happen within the State of Oregon. Sectors including power generation, agriculture and transportation. And activities such as investments to improve efficiency of material or energy by upgrading equipment, installing energy efficient lighting and replacing gasoline powered vehicles with electric ones, etc. The in-boundary or sector emissions amount to 61.4 million metric tons of carbon equivalents(CO2e).
Consumption-based inventory: The Blue/Green Circle - Asks the question: What does it take in terms of carbon emissions to maintain the Oregon way of living? This questions lead us to examine all the things Oregonians use everyday that isn’t produced in Oregon. For example, 60% of the food that we consume is imported from different states and countries (see next section). Same for cars, electronics, clothing, and many different building materials. When all this is added up we get a fuller picture of what Oregon’s contribution to climate affecting pollution really is, and it come to 95.6 million metric tons of carbon equivalents(CO2e).
The overlap - Green oval represents the shared aspects such as waste management and in-state transportation.


Oregon and the Global Material Networks
One of the first things that a consumption-based outlook gives us is an acknowledgement of how much Oregon is connected to the rest of the world. Whereas the in-boundary inventory show the activities of Oregonians, the consumption outlook shows just how much we rely on other states and other countries for maintaining our way of life. For example, the second bar in the chart to the right shows how the vast majority of the emissions related to the food we purchase are occurring in other states in the US and other countries. And for vehicles and parts, the first bar, most of the emissions are in-state because that’s where the vehicles are being driven. In sum, nearly 70% of the emissions are happing somewhere else on our behalf.
Examining this chart further from the build environment perspective, reveals that aside from construction, many different sectors and categories contribute to the overall impacts of the built spaces of Oregon. Things like: vehicles, appliances, services, transportation, electronics, furnishing, lighting, water and wastewater treatment.
Oregonians Contribution to Carbon Emissions
TBD
Climate Vulnerability
TBD